Fluorescent Proteins:
A Modern, Scientifically-Driven Overview for Bioimaging & Biosensing
Fluorescent proteins (FPs) are genetically encoded biomarkers that have revolutionized live-cell imaging, super-resolution microscopy, and biosensor design. Originally isolated from the jellyfish Aequorea victoria, these proteins exhibit intrinsic fluorescence without requiring external cofactors, allowing minimally invasive, high-contrast visualization of proteins, organelles, and dynamic cellular processes in vivo.
1. Engineering the Spectral Palette
FPs span the entire visible spectrum, from near-UV/blue to far-red/near-infrared emission, thanks to targeted mutagenesis and directed evolution of chromophore structures:
Blue and Cyan Variants (BFP, CFP): Engineered by substitutions in the GFP chromophore (e.g., Tyr66 → His or Trp) to shorten π-conjugation length, yielding emissions around 445–485 nm.
Green Variants (GFP, EGFP, sfGFP): Optimized for brightness, folding efficiency, and thermal stability; EGFP remains the standard tool in live-cell imaging due to its compatibility with common 488 nm laser excitation.
Yellow and Orange FPs (YFP, mKO, mOrange): Mutations such as Thr203 → Tyr extend emission into longer wavelengths, reducing cellular autofluorescence and improving spectral separation.
Red & Far-Red Proteins (mCherry, mScarlet, mNeptune): Derived from coral FPs, these exhibit deep-tissue penetration and lower phototoxicity, crucial for in vivo and multicolor imaging.
This engineered palette enables multicolor labeling, colocalization studies, and complex reporter systems with minimal spectral overlap.
Figure: Comparative Structural Organization of Fluorescent Proteins and Their Associated Chromophores
This figure presents the structural diversity of major fluorescent protein (FP) families and the chemical nature of their chromophores. (A) The GFP-like fluorescent protein structure (PDB ID: 2y0g) illustrates the characteristic β-barrel architecture enclosing an autocatalytically formed chromophore, typical of GFP-derived variants (1–9). (B) The FAST protein structure (PDB ID: 6umz), engineered from Photoactive Yellow Protein (PYP), differs mechanistically by binding external synthetic chromophores such as HMBR and HBR-3, 5DOM, enabling green and red fluorescence, respectively. (C) The UnaG structure (PDB ID: 4i3d) demonstrates fluorescence activation upon binding to its external chromophore bilirubin. (D) The miRFP structure (PDB ID: 5viv) belongs to the near-infrared fluorescent protein family and utilizes biliverdin as an external chromophore. Together, these structural models highlight the distinction between autocatalytic chromophore formation and ligand-dependent fluorescence mechanisms across different fluorescent protein platforms.
Figure: Advanced Super-Resolution Imaging Strategies and Illumination Schemes
This figure illustrates the fundamental principles and optical strategies used in super-resolution (SR) fluorescence microscopy. (A) In single-molecule localization microscopy (SMLM), a stochastic activation approach is applied, where individual fluorophores are randomly switched on and localized with high precision. The final SR image is reconstructed from multiple image frames by fitting each detected emitter with a Gaussian point spread function to determine its exact position. (B) Engineered illumination-based approaches are shown for STED, SSIM, and SPoD-ExPAN microscopy. In STED microscopy, a Gaussian excitation beam is overlapped with a doughnut-shaped depletion beam to confine fluorescence emission. In SSIM, structured illumination patterns are projected and rotated to enhance spatial resolution isotropically. In SPoD-ExPAN microscopy, linearly polarized excitation and STED beams with orthogonal polarization planes are applied and rotated to achieve improved spatial precision. (C) The RESOLFT microscopy scheme using negative reversibly switchable fluorescent proteins (n-rsFPs) involves a three-step process: ON-switching with a Gaussian beam, OFF-switching with a doughnut-shaped beam, followed by fluorescence excitation and readout. (D) In contrast, RESOLFT with positive rsFPs relies on scanning the overlap between Gaussian-shaped excitation/ON-switching light and a doughnut-shaped OFF-switching beam to achieve sub-diffraction resolution imaging.
2. Photophysics & Chromophore Tuning
The optical properties of FPs excitation/emission spectra, quantum yield, brightness, Stokes shift, and photostability are dictated by chromophore structure and local protein environment. Structural manipulation of the π-electron system allows precision tuning:
Enhanced brightness and stability are achieved through mutations that optimize chromophore planarity and β-barrel rigidity.
Some advanced FPs exhibit large Stokes shifts, expanding usable spectral windows and enhancing contrast in Förster Resonance Energy Transfer (FRET) experiments.
Engineering efforts such as directed evolution, rational design, and high-throughput screening continue to yield variants with improved photophysical metrics for cutting-edge microscopy.
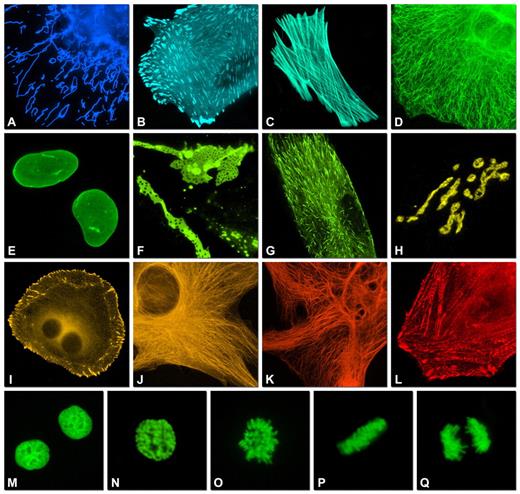
Figure: Subcellular Targeting of Monomeric Fluorescent Protein Fusions and Chromatin Dynamics During Mitosis
This figure presents the subcellular localization of selected monomeric fluorescent protein (FP) fusions expressed in cells and visualized by widefield fluorescence microscopy. Images are pseudocolored according to each FP emission spectrum. The fusion orientation (N- or C-terminal) and the number of linker amino acids are indicated following the organelle or fusion protein name.
(A) EBFP2 fused to the mitochondrial targeting sequence of human cytochrome c oxidase subunit VIII labels mitochondria.
(B) mCerulean–paxillin localizes to focal adhesions.
(C) mTFP1–β-actin highlights filamentous actin structures.
(D) mEmerald–keratin labels intermediate filaments.
(E) superfolder GFP–lamin B1 outlines the nuclear envelope.
(F) mVenus–connexin-43 marks gap junctions.
(G) YPet–EB3 associates with microtubule plus ends.
(H) mKO–Golgi targeting sequence labels the Golgi complex.
(I) tdTomato–zyxin localizes to focal adhesions.
(J) TagRFP–α-tubulin visualizes microtubules.
(K) mCherry–vimentin labels intermediate filaments.
(L) mPlum–α-actinin decorates cytoskeletal structures.
(M–Q) Fusion of mEGFP to human histone H2B enables visualization of chromatin dynamics throughout mitosis: (M) interphase, (N) prophase, (O) prometaphase, (P) metaphase, and (Q) anaphase. Together, these images demonstrate the versatility of monomeric FP fusions for precise subcellular labeling and real-time monitoring of cellular architecture and chromosome segregation.
3. Applications in Modern Cell Biology
🧪 Live-Cell Imaging & Fusion Tags
FPs fused to proteins, organelles, or cellular structures enable real-time visualization of dynamic processes without exogenous dyes. Their genetic encoding ensures co-expression with biological targets. Canonical applications include:
Subcellular targeting (nucleus, mitochondria, cytoskeleton)
Tracking protein localization and trafficking
Monitoring cell cycle progression and mitosis
These capabilities are foundational to dynamic studies in developmental biology, neuroscience, and cell signaling.
🔁 FRET Biosensors & Interaction Studies
FP pairs with overlapping emission/absorption profiles (e.g., CFP–YFP or mCerulean–Venus) serve as FRET donor–acceptor pairs, reporting proximity changes at the nanoscale (1–10 nm), linking fluorescence shifts to molecular interactions or biochemical events.
🔄 Photoswitchable & Super-Resolution Tools
Advanced engineered FPs exhibit reversible photoswitching and photoactivation (e.g., Dronpa, EosFP), enabling super-resolution techniques such as PALM/STORM with nanoscale organization maps inside living cells.
Recent reviews highlight the integration of photoswitchable FPs into super-resolution and advanced photophysical imaging platforms, broadening the limits of optical imaging.

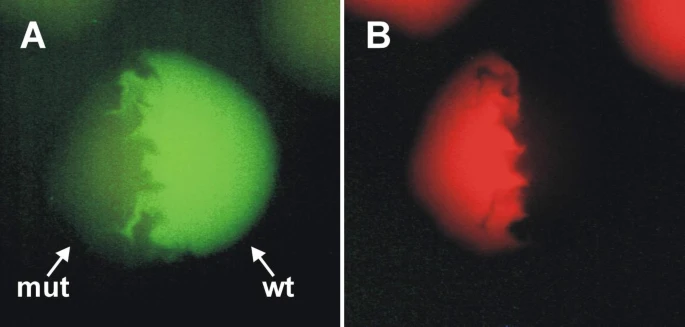
Figure: Dual-Color Fluorescence of Wild Type and Mutant dsFP483 Expressed in E. coli Colonies
Fluorescence microscopy images of E. coli colonies expressing either wild type dsFP483 (wt) or the N68S/I112S mutant (mut) are shown using two different filter sets. (A) Under the FITC filter set, colonies expressing the wild type protein display strong green fluorescence. (B) Under the TRITC filter set, the wild type colonies are not visibly fluorescent, confirming their single green emission profile.
In contrast, colonies expressing the dsFP483-N68S/I112S mutant are clearly detectable with both FITC and TRITC filter sets, demonstrating dual-color fluorescence. This indicates that the N68S/I112S substitutions alter the spectral properties of dsFP483, enabling simultaneous green and red emission and highlighting the impact of targeted mutations on fluorescent protein photophysical behavior.
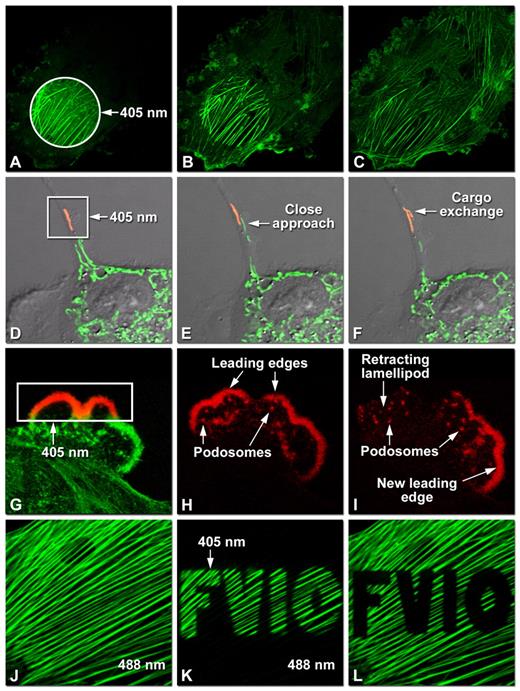
Figure: Dynamic Imaging of Optical Highlighter Fluorescent Proteins by Confocal Microscopy
This figure demonstrates the use of optical highlighter fluorescent proteins (FPs) for tracking protein dynamics and organelle behavior in living cells using laser scanning confocal microscopy.
(A–C) Photoactivation of mPA-GFP fused to actin in opossum kidney (OK) epithelial cells. (A) A circular region of interest is illuminated at 405 nm for 5 seconds (t = 0 min). (B) At t = 5 min, the activated actin redistributes toward membrane ruffles as fluorescence decreases in the initial activation zone. (C) By t = 60 min, fluorescence intensity increases in ruffles, cytoplasmic actin pools, and the filamentous actin network, illustrating cytoskeletal remodeling.
(D–F) Photoconversion of mitochondria labeled with tdEos in rabbit kidney (RK-13) epithelial cells. (D) A single mitochondrion is photoconverted from green to red fluorescence using 405 nm illumination (t = 0 min). (E) At t = 10 min, a non-converted (green) mitochondrion approaches the converted one. (F) By t = 20 min, cargo exchange between mitochondria is observed, highlighting mitochondrial interaction and content mixing.
(G–I) Analysis of lamellipodia dynamics using Dendra2 fused to actin in OK cells. (G) A selected region is photoconverted to red fluorescence at 405 nm (t = 0 min). (H) At t = 20 min, photoconverted actin reveals podosome formation and leading-edge remodeling. (I) At t = 45 min, lamellipodial retraction occurs alongside increased podosome formation and emergence of a new leading edge.
(J–L) Photoswitching of actin labeled with Dronpa in rat thoracic aorta (A7r5) myoblasts. (J) The actin cytoskeleton is initially imaged with 488 nm excitation (t = 0 min). (K) After switching the fluorescence off at 488 nm, a defined region (“FV10”) is reactivated using 405 nm light (t = 3 min). (L) The reactivated region is subsequently photobleached during continued imaging at 488 nm.
Together, these experiments illustrate how photoactivation, photoconversion, and photoswitching strategies enable precise spatial and temporal tracking of cytoskeletal dynamics and organelle interactions in live-cell imaging.
4. Challenges & Future Directions
Despite extensive progress, several challenges remain at the forefront of FP research:
Photostability vs. brightness trade-off: Red and far-red FPs often have lower brightness or maturation efficiency than green variants.
Monomerization: Many natural coral-derived proteins require mutagenesis to avoid oligomerization, which can disrupt fusion protein function.
Expanding spectral range: Development of near-infrared and multiplexable fluorescent tags continues to be a priority for deep tissue imaging and high-dimensional microscopy.
Recent research in infrared fluorescent proteins and genetically encoded Raman probes points toward future capabilities beyond traditional fluorescence.