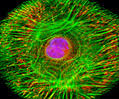
Normal African Green Monkey Kidney Fibroblast Cells (CV-1 Cell Line)
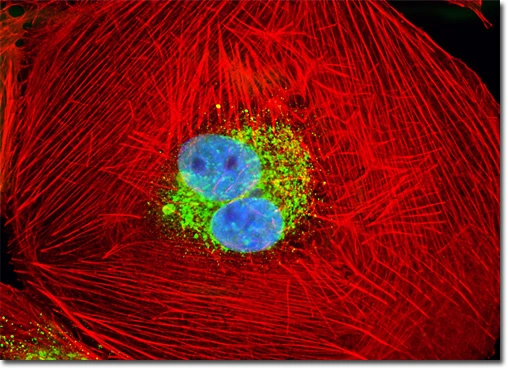
A logarithmic (log-phase), adherent culture of African green monkey kidney fibroblast cells (CV-1 line) was labeled using a classical triple-fluorescence staining protocol to visualize key subcellular structures:
MitoTracker® Red CMXRos – selectively accumulates in active mitochondria in a membrane potential–dependent manner.
DAPI (4′,6-diamidino-2-phenylindole) – binds strongly to DNA, staining cell nuclei.
Alexa Fluor® 488–phalloidin – specifically binds filamentous actin (F-actin), highlighting the cytoskeletal network.
This combination enables simultaneous visualization of mitochondrial distribution (red), nuclear morphology (blue), and cytoskeletal architecture (green), providing a comprehensive structural overview of healthy proliferating fibroblast cells under confocal fluorescence microscopy.
CV-1 Cell Line: Origin, Characteristics, and Imaging
The CV-1 cell line was established in March 1964 by F. C. Jensen and colleagues from kidney tissue obtained from a normal adult male African green monkey (Cercopithecus aethiops). Initially developed for studies on transformation by Rous sarcoma virus (RSV), the fibroblast-derived line later became widely used in AIDS research and in transfection experiments involving simian virus 40 (SV40) and recombinant plasmid vectors.
CV-1 cells display classic fibroblast morphology, grow adherently on glass or plastic substrates, and test negative for reverse transcriptase activity. They are highly permissive to viral infection, including poliovirus type 1, herpes simplex virus, SV40, California encephalitis virus, and Eastern and Western equine encephalitis viruses. The line is characterized by rapid proliferation, although chromosomal variation has been reported at high passage numbers.
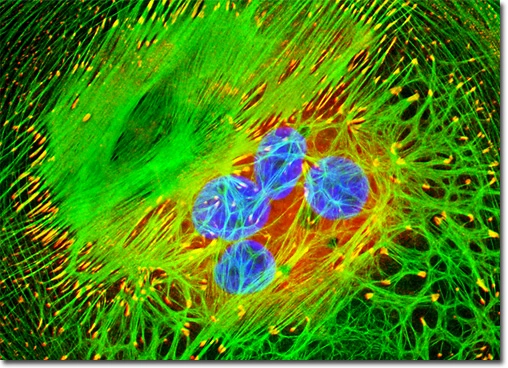
Immunofluorescence Labeling and Imaging
An adherent, logarithmically growing CV-1 monolayer culture was subjected to multi-label immunofluorescence staining:
α-Tubulin was detected using a mouse monoclonal anti-bovine α-tubulin primary antibody, followed by fluorescein-conjugated goat anti-mouse Fab fragments.
DNA was counterstained with DAPI, a UV-excited nuclear probe.
F-actin was labeled with Alexa Fluor 568–conjugated phalloidin to visualize the cytoskeletal filament network.
Images were acquired in grayscale using a QImaging Retiga Fast-EXi digital camera mounted on an Olympus BX-51 fluorescence microscope equipped with bandpass emission filter sets (Omega Optical). During post-processing, individual fluorescence channels were pseudocolored using RGB assignments corresponding to the emission spectra of each fluorophore, generating a composite multicolor image.
Fibroblast Biology and Confocal Imaging of CV-1 Cells
Fibroblasts, including those of the CV-1 cell line, originate from the mesenchyme—an embryonic connective tissue composed of loosely organized, stellate cells embedded in a gelatinous extracellular matrix. After birth, a small population of mesenchymal cells persists within tissues (notably around small blood vessels) and can differentiate into fibroblasts when required, particularly during tissue injury.
Fibroblasts are essential mediators of wound healing. They synthesize extracellular matrix components, most importantly collagen, the primary structural protein of scar tissue. Although scar formation is vital for tissue repair, scar tissue is functionally inferior to the original tissue, lacking structures such as hair follicles and sweat glands and showing increased sensitivity to ultraviolet radiation.
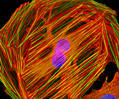
Multicolor Fluorescence Imaging of CV-1 Fibroblasts
The illustrated digital image shows a cultured CV-1 fibroblast monolayer labeled with three fluorescent probes:
Wheat germ agglutinin (WGA)–Oregon Green 488 – highlights the intracellular Golgi network.
Alexa Fluor 568–phalloidin – binds specifically to filamentous actin (F-actin), revealing cytoskeletal organization.
DAPI – stains nuclear DNA.
The resulting image demonstrates strong signal intensity and sharp structural definition across all three fluorescence channels.
Images were acquired in grayscale using a QImaging Retiga Fast-EXi digital camera mounted on an Olympus BX-51 fluorescence microscope equipped with bandpass emission filter sets (Omega Optical). During post-acquisition processing, each fluorescence channel was pseudocolored using RGB values corresponding to the emission spectra of the respective fluorophores, producing a composite multichannel image.
Development of Fluorochromes and Immunofluorescence
Fluorochromes were first introduced in the early twentieth century as vital stains for microorganisms such as bacteria, protozoa, and trypanosomes. Their broader application emerged in the 1920s, when fluorescence microscopy began to be used to investigate dye binding in fixed tissues and living cells. A major breakthrough occurred in the early 1940s, when Albert Coons developed a method for conjugating fluorescent dyes to antibodies, establishing the foundation of immunofluorescence.
Subsequent advances in immunology and molecular biology have greatly expanded the range of available primary and secondary antibodies and enabled the rational design of highly specific fluorescent probes targeting defined molecular structures within cells.
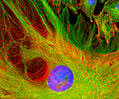
Immunofluorescent Labeling of CV-1 Cells
The African green monkey kidney (CV-1) cell culture shown in the image was subjected to multicolor immunofluorescence labeling:
Vinculin Detection: Cells were incubated with mouse monoclonal anti-vinculin primary antibodies, followed by goat anti-mouse Fab fragments conjugated to Cy3 (red emission). Vinculin is a key component of focal adhesions and adherens junctions, linking the plasma membrane to the actin cytoskeleton and serving as a structural and signaling scaffold.
F-Actin Visualization: The actin cytoskeleton was stained with Alexa Fluor 488–conjugated phalloidin (green emission).
Nuclear Counterstain: DNA was labeled with DAPI (blue emission).
Images were acquired in grayscale using a QImaging Retiga Fast-EXi digital camera mounted on an Olympus BX-51 fluorescence microscope equipped with bandpass emission filter sets. During image processing, individual fluorescence channels were pseudocolored according to the emission spectra of the respective fluorophores and merged to produce a composite multichannel image.